
In November 2020 The Lancet published the largest study of child and adolescent growth ever assembled: 2,181 population-based studies, roughly 65 million participants, 200 countries and territories, and height trends running from 1985 to 2019. It was built at Imperial College London, which is worth saying plainly, because the league table it produced is routinely quoted in Britain without anyone mentioning that Britain made it.
The headline finding is the 20 cm gap between the tallest and shortest nineteen-year-olds in the world. The finding that should interest a British reader more is where the United Kingdom sits in that table, and where it used to sit. British boys have slipped from 28th to 39th since 1985. British girls have slipped from 42nd to 49th. This happened in a country that measures more than a million of its own children every single year.
The study, and who built it
The paper is titled “Height and body-mass index trajectories of school-aged children and adolescents from 1985 to 2019 in 200 countries and territories: a pooled analysis of 2181 population-based studies with 65 million participants”. Andrea Rodriguez-Martinez led the statistical analysis and wrote the first draft; Professor Majid Ezzati of Imperial’s School of Public Health is the corresponding author.
| The study in numbers | |
|---|---|
| Collaborators | 1,393 |
| Population-based studies pooled | 2,181 |
| Participants | About 65 million, of whom 50 million aged 5 to 19 |
| Countries and territories with estimates | 200, using data from 193 |
| Age range | 5 to 19 |
| Height data years | 1971 to 2019, with trends estimated from 1985 |

The top and bottom of the table
These are the modelled mean heights at age nineteen in 2019, with the ranges the authors publish alongside them. The ranges are wide, and quoting the central figure alone makes the data look more precise than it is.
| Country | Mean height at 19 | Published range | |
|---|---|---|---|
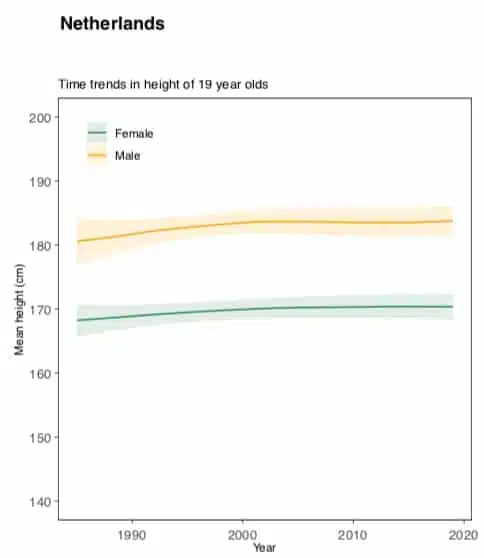
| Tallest boys | Netherlands | 183.8 cm | 181.5 to 186.2 cm |
| Tallest girls | Netherlands | 170.4 cm | 168.3 to 172.4 cm |
| Shortest boys | Timor-Leste | 160.1 cm | 158.0 to 162.2 cm |
| Shortest girls | Guatemala | 150.9 cm | 149.4 to 152.4 cm |
The paper describes the gap as 20 cm or higher. On the central estimates it is 23.7 cm for boys and 19.5 cm for girls, so the round figure of 20 cm that circulates everywhere understates the boys’ gap and slightly overstates the girls’. The authors translate it into time rather than distance, which is more vivid: eight years of growth for girls, six for boys. A nineteen-year-old woman in Guatemala or Bangladesh is the height of an average Dutch girl of eleven.
The top three in each ranking:
| Girls | Boys | |
|---|---|---|
| Tallest | Netherlands, Montenegro, Denmark | Netherlands, Montenegro, Estonia |
| Shortest | Guatemala, Bangladesh, Nepal | Timor-Leste, Laos, Solomon Islands |
Where Britain sits, and where it used to
This is the part the international coverage skipped, and it is the reason this article exists.
| 1985 | 2019 | Change | Rank 1985 | Rank 2019 | |
|---|---|---|---|---|---|
| UK boys at 19 | 176.3 cm | 178.2 cm | +1.9 cm | 28th | 39th |
| UK girls at 19 | 162.7 cm | 163.9 cm | +1.2 cm | 42nd | 49th |
British teenagers did get taller. They got taller by 1.9 cm and 1.2 cm across thirty-four years, while much of Asia and parts of Europe moved several times faster, and so Britain fell eleven places in the boys’ table and seven in the girls’. Imperial’s own summary of the work puts it bluntly: the UK’s global height ranking has worsened over the past thirty-five years.
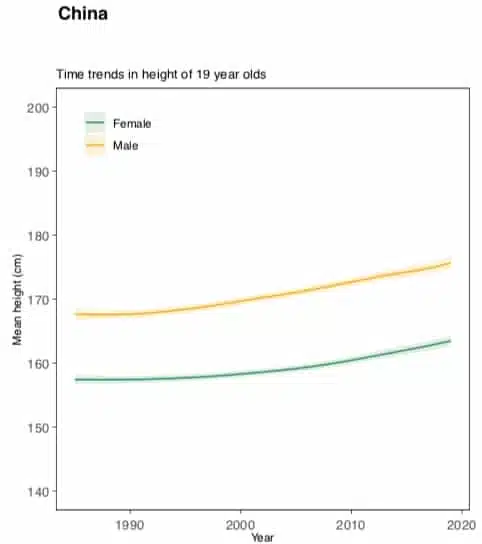
For comparison, Chinese nineteen-year-old boys gained 8.1 cm over thirty years and Chinese girls 6.1 cm, the largest gains in the study. French girls gained 1.3 cm, which is roughly the British rate. Ezzati’s team attributed the British lag to insufficient access to nutritious food among families who cannot afford it.
A British nineteen-year-old boy is therefore 5.6 cm shorter than a Dutch one, and a British girl 6.5 cm shorter. If you are reading this site because you are tall, that is the statistical context: tall in Britain is a greater departure from the national average than tall in the Netherlands, and the shops, doorways and vehicle cabins designed around the British average reflect it.
England measures a million children a year, and stops at eleven
Here is the odd thing about British height data. Britain’s figure for nineteen-year-olds in the table above is modelled from pooled studies. Britain’s figures for young children are measured directly, at a scale almost no other country attempts.
The National Child Measurement Programme records the height and weight of children in England in two school years: Reception, aged four and five, and Year 6, aged ten and eleven. In 2024-25 it measured 1,145,893 children, with a participation rate of 94.1 per cent. There is no sampling and no volunteering problem on that scale; it is close to a census of English childhood at two fixed ages.
What it gives is exceptional. What it misses is adolescence. The programme stops at eleven, which is before the growth spurt that decides adult height, and there is no national measurement at fourteen, sixteen or nineteen. So the country with one of the best child height datasets in the world has to rely on modelling for the age at which the international league tables are compiled. If Britain wanted to know why it is falling down the table, the measurement stops just before the answer.
What the English measurements do show
An analysis of the programme’s data from 2009-10 onwards found that English child height has not fallen, but has barely risen. Average height among five-year-olds rose 0.2 cm across the decade to 2019. Among eleven-year-olds it rose 0.7 cm.
There is one sharp exception. Between 2019-20 and 2020-21, the first pandemic year, eleven-year-old boys gained 1.3 cm and girls 0.7 cm, with smaller rises at five. A jump of that size in twelve months is not a nutrition story.
The researchers link it, and the slower underlying rise, to increasing obesity: excess weight advances growth, so heavier children measure taller. Over the same decade, overweight and obesity among the most deprived tenth of English children rose from 25.2 to 27.4 per cent in Reception and from 36.4 to 42.0 per cent in Year 6, and fell in the least deprived tenth.
The deprivation gap in height narrowed as a result. Among Year 6 boys, the most deprived decile moved from 144.4 cm to 145.2 cm and the least deprived from 145.4 cm to 146.1 cm, closing the gap from 1.0 cm to 0.9 cm. Among Year 6 girls the gap closed from 0.6 cm to 0.1 cm. It closed because the poorest children grew fastest, at the same time as their obesity rates climbed hardest.
That conclusion cuts against the simple reading of the Lancet study. Internationally, across thirty-five years and two hundred countries, height is a reliable measure of childhood nutrition. Within one wealthy country across one recent decade, it may be measuring the wrong thing. Both findings come from the same discipline, and the honest position is to hold them together rather than pick the convenient one.
Why countries differ
The study’s own account of the causes is short, and the ordering matters.
- Diet and nutrition, particularly during the school years.
- Economic conditions.
- The quality of national public health provision.
Rodriguez-Martinez’s stated conclusion is that genetics plays only a small part in explaining differences between populations, compared with nutrition and environment. Genes strongly determine where an individual sits within a population; they do not explain why one population’s average is 20 cm above another’s. She added that targeted nutrition programmes aimed at early childhood and the school years, reaching the population broadly, have the largest effect on raising average height. Our longer piece on which country has the biggest average height works through the same three variables for adults.
Other findings worth keeping
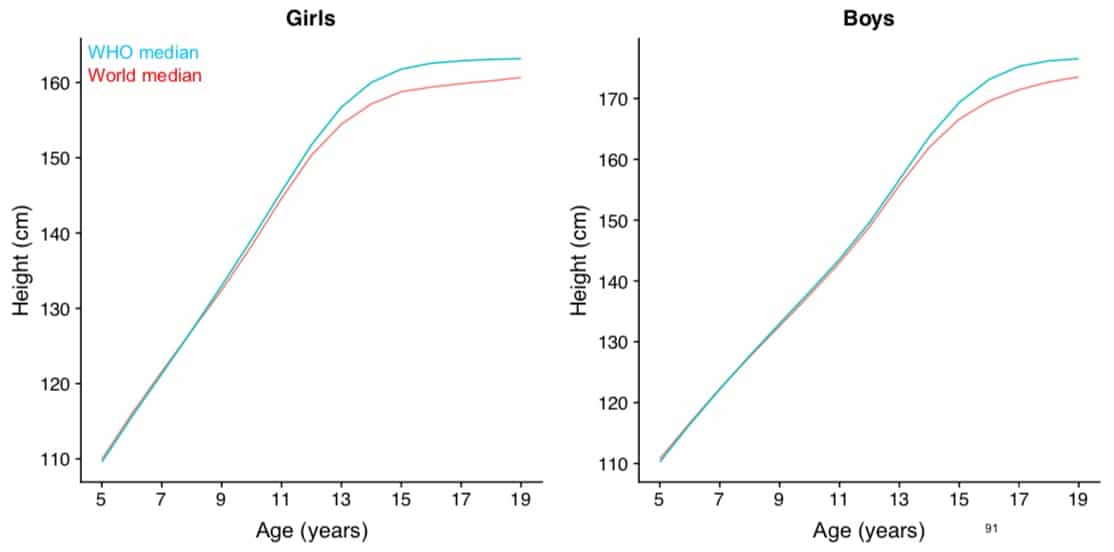
- Average height at age five is similar in every country studied. The divergence happens later, during the school years, which is what makes school food policy the lever the authors point to.
- Countries affected by internal conflict or war showed the least progress.
- The largest height gains were concentrated in Asia; the smallest in sub-Saharan Africa.
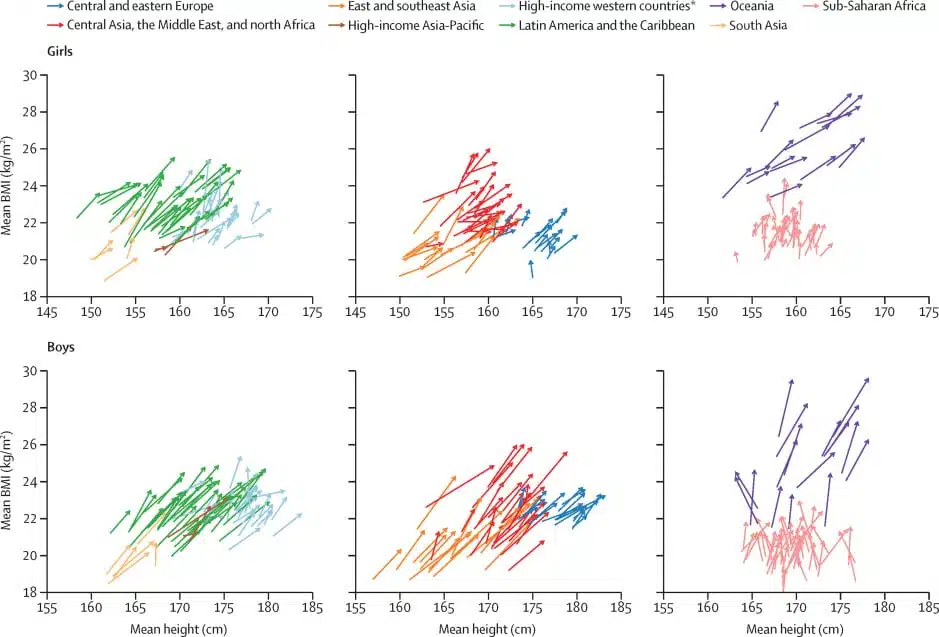
- Oceania recorded the largest rise in body-mass index, particularly among boys. Latin American countries also rose sharply.
- Most countries increased both average height and average BMI, which is the pattern the English data warns about: the two move together, and rising height is not automatically good news.
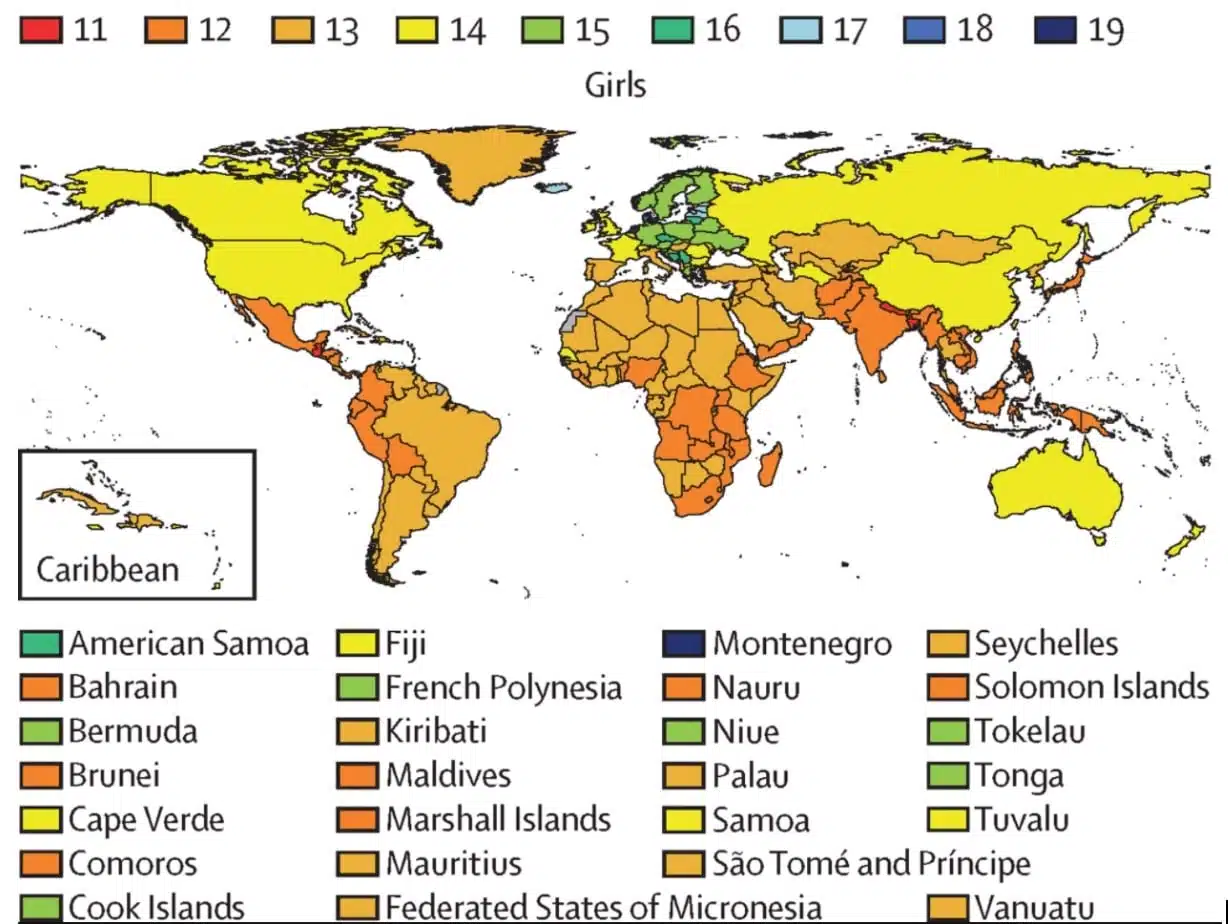
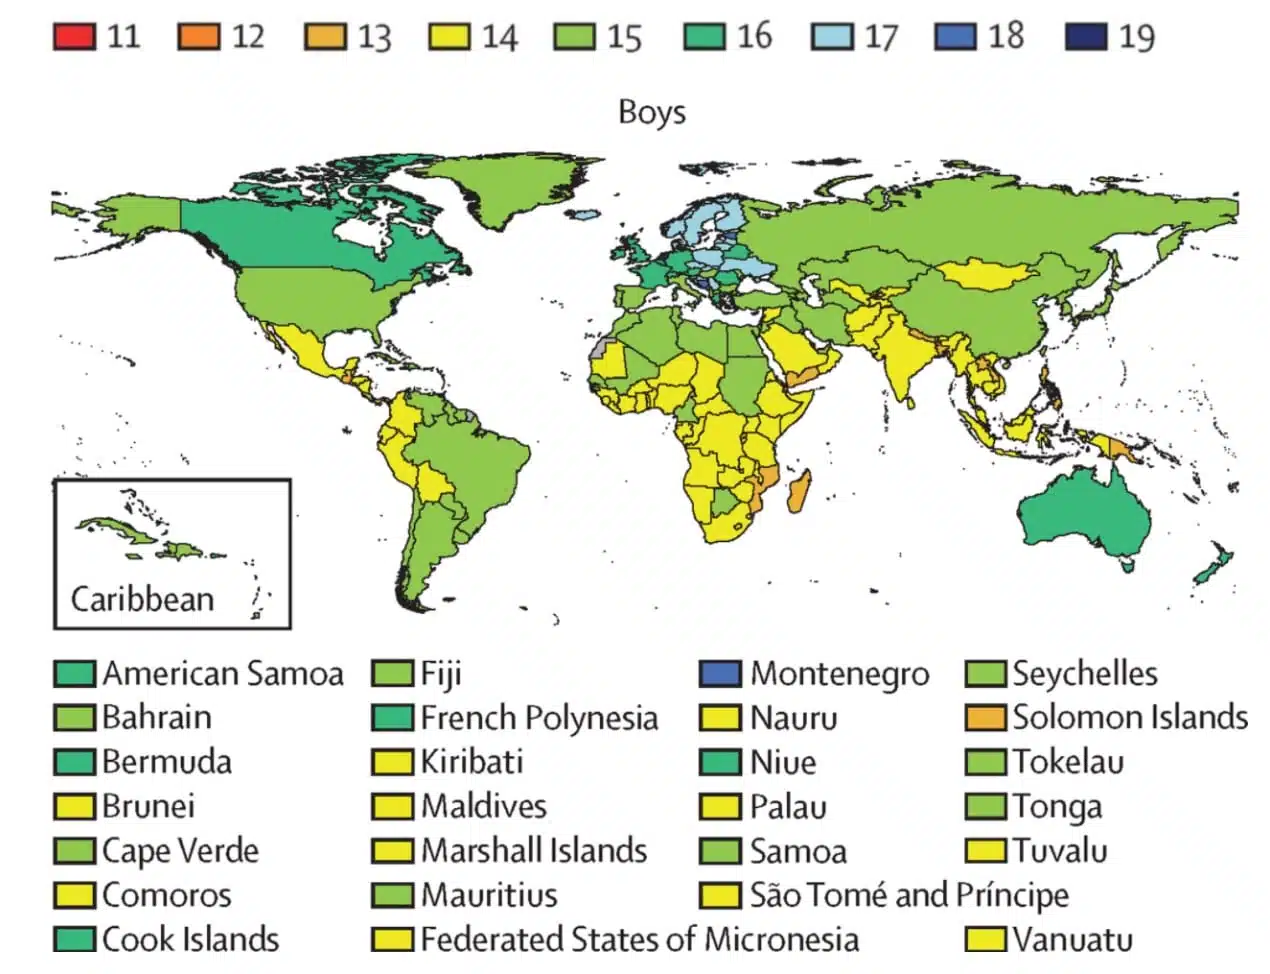
- French nineteen-year-old boys are the height of Dutch sixteen-year-olds. French nineteen-year-old girls are the height of Dutch fourteen-year-olds.
The study in charts
Age at which a Dutch girl reaches the height a nineteen-year-old girl in each country reaches
The same comparison for boys
French growth over the period
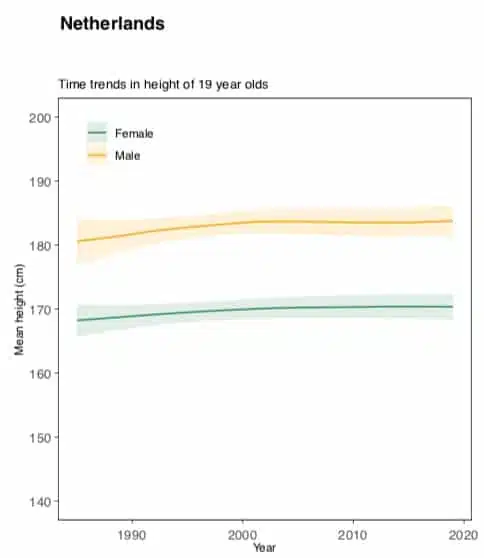
Dutch growth over the period, the highest average in the study
Chinese growth over the period, the largest gain in the study
Median height of the world population compared with adolescents born in 2000
What to take from it
Three things, in order of how much confidence the data supports.
First, the international finding is solid. A 20 cm range between national averages at nineteen is not genetic, it is nutritional and economic, and it is reversible within a generation, as China’s 8.1 cm demonstrates.
Second, Britain’s position in the table has deteriorated, and the researchers who built the table attribute that to food poverty rather than to anything about British bodies. That is a policy finding, not a biological one.
Third, and most carefully: rising average height is not by itself evidence of improving child health in a rich country, because obesity raises it too. England has the measurements to see that distinction, and sees it. Most countries do not.
If you want the other end of this subject, we have written about Olivier Rioux, the tallest teenager in the world, Zhang Ziyu, the tallest teenage girl, and Eric Kilburn, the teenager with giant feet and hands, where growth is an individual story rather than a national average.
Sources
- The Lancet: height and body-mass index trajectories of school-aged children and adolescents, 1985 to 2019
- Imperial College London: the 20 cm height gap, and the UK’s figures and rankings
- National Child Measurement Programme, 2024-25 results
- NHS England: National Child Measurement Programme, method and coverage
- Oxford University Research Archive: English child height and obesity trends from NCMP data
- World Health Organization